Subplots with matplotlib
Here’s the table of contents:
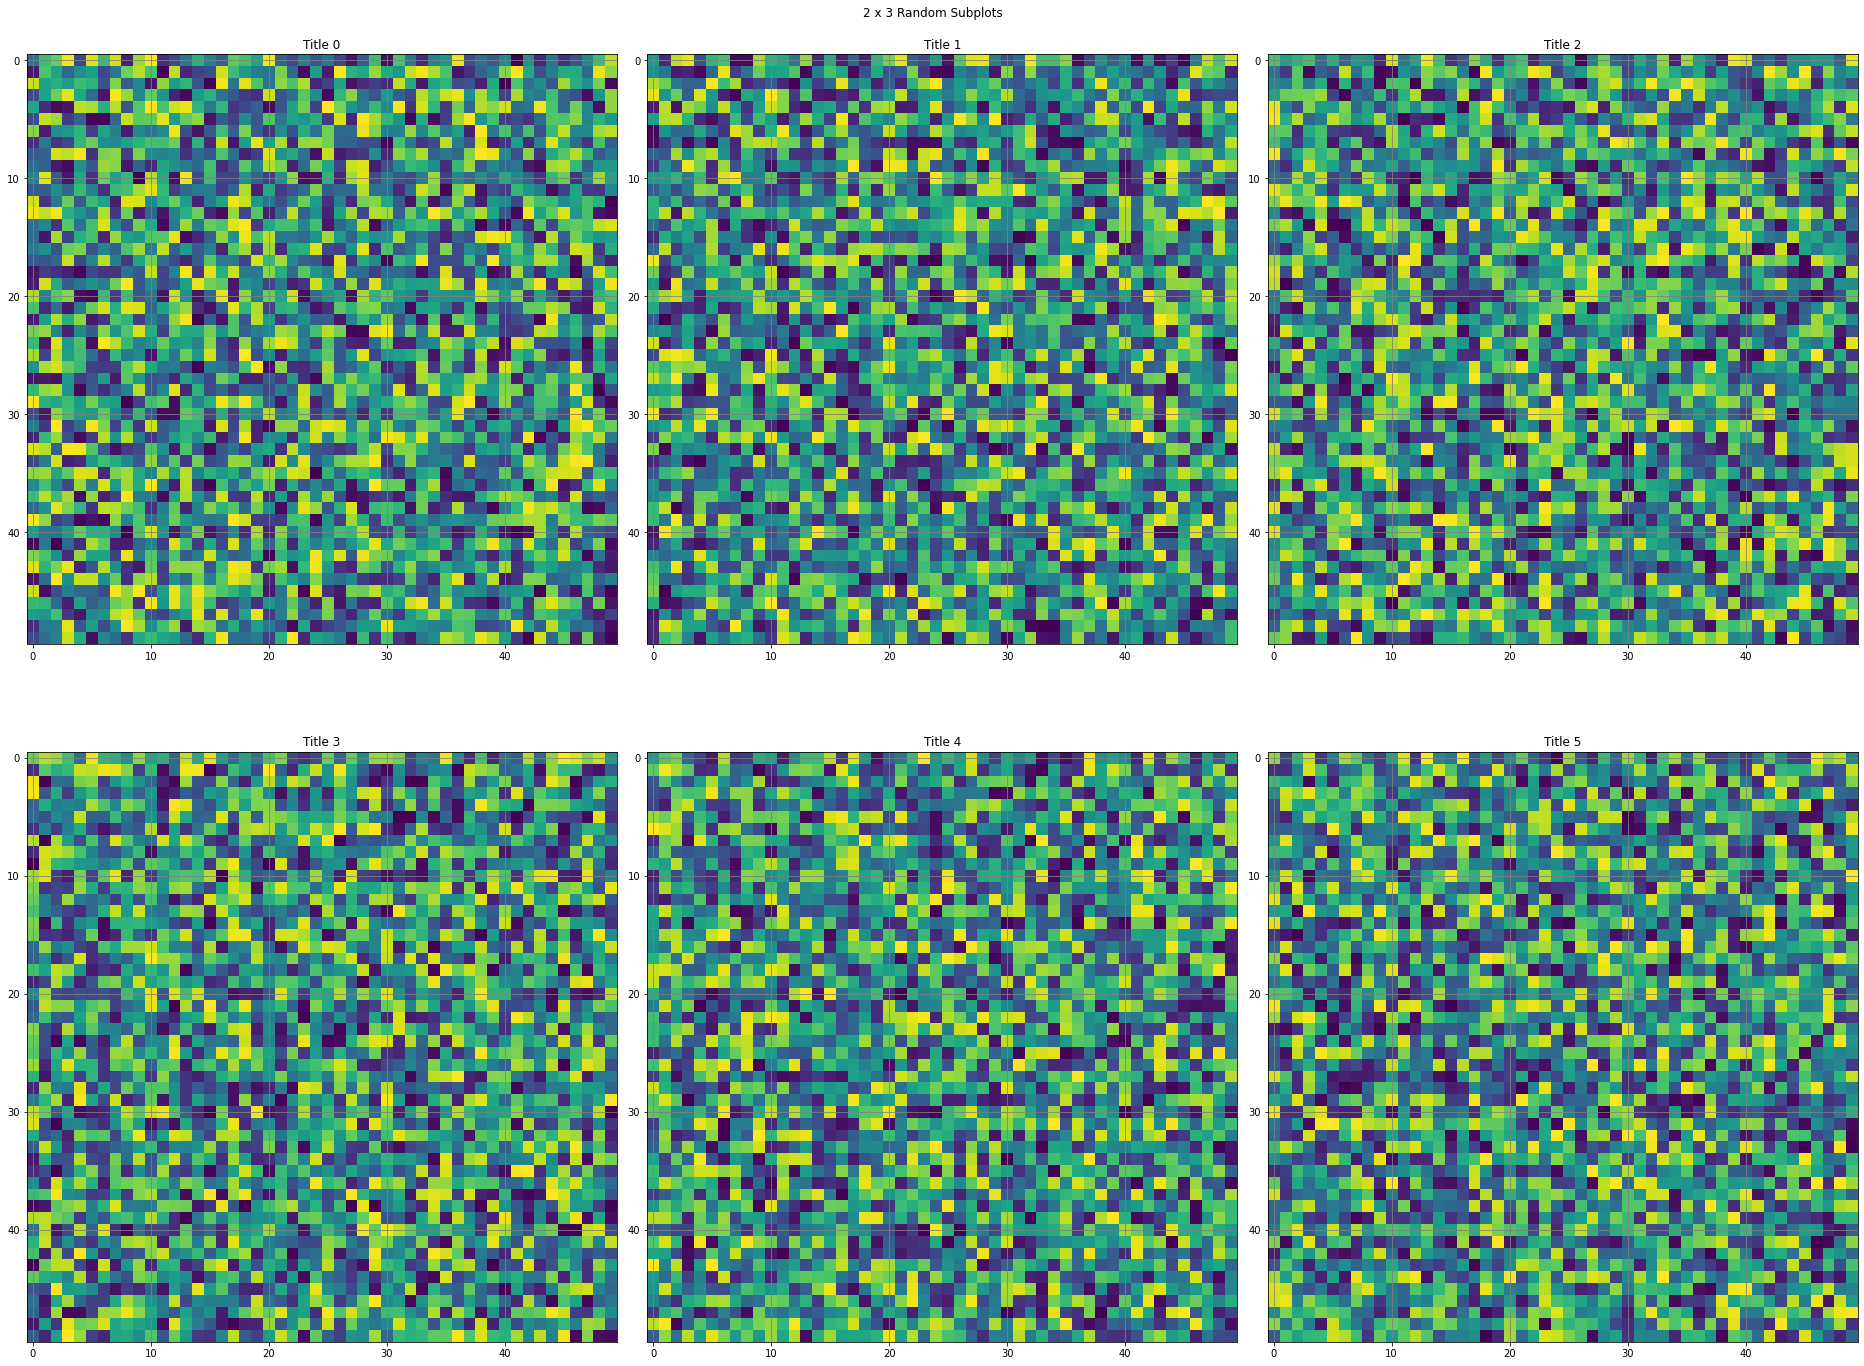
Snippet to draw subplots
from matplotlib import pylab as plt
from numpy import random

fig, ax = plt.subplots(2,3,figsize = (26,20))

fig.suptitle('2 x 3 Random Subplots')

ax[0,0].set_title("Title 0")
ax[0,0].imshow(random.random((50,50)))
ax[0,0].grid(b=True, which='major', color='gray', linestyle='-');

ax[0,1].set_title("Title 1")
ax[0,1].imshow(random.random((50,50)))
ax[0,1].grid(b=True, which='major', color='gray', linestyle='-');

ax[0,2].set_title("Title 2")
ax[0,2].imshow(random.random((50,50)))
ax[0,2].grid(b=True, which='major', color='gray', linestyle='-');

ax[1,0].set_title("Title 3")
ax[1,0].imshow(random.random((50,50)))
ax[1,0].grid(b=True, which='major', color='gray', linestyle='-');

ax[1,1].set_title("Title 4")
ax[1,1].imshow(random.random((50,50)))
ax[1,1].grid(b=True, which='major', color='gray', linestyle='-');

ax[1,2].set_title("Title 5")
ax[1,2].imshow(random.random((50,50)))
ax[1,2].grid(b=True, which='major', color='gray', linestyle='-');

plt.tight_layout();
plt.show();
Snippet to draw subplots with one row
from matplotlib import pylab as plt
from numpy import random

maxJ = 5;
fig, ax = plt.subplots(1,maxJ,figsize = (26,20))

fig.suptitle('1 x '+str(maxJ)+' Random Subplots')

for j in range(0, maxJ):
  ax[j].set_title("Title 0")
  ax[j].imshow(random.random((50,50)))
  ax[j].grid(b=True, which='major', color='gray', linestyle='-');

plt.tight_layout();
plt.show();